Key support level: $ 0.000030
Key Resistance Level: 0.000034 $
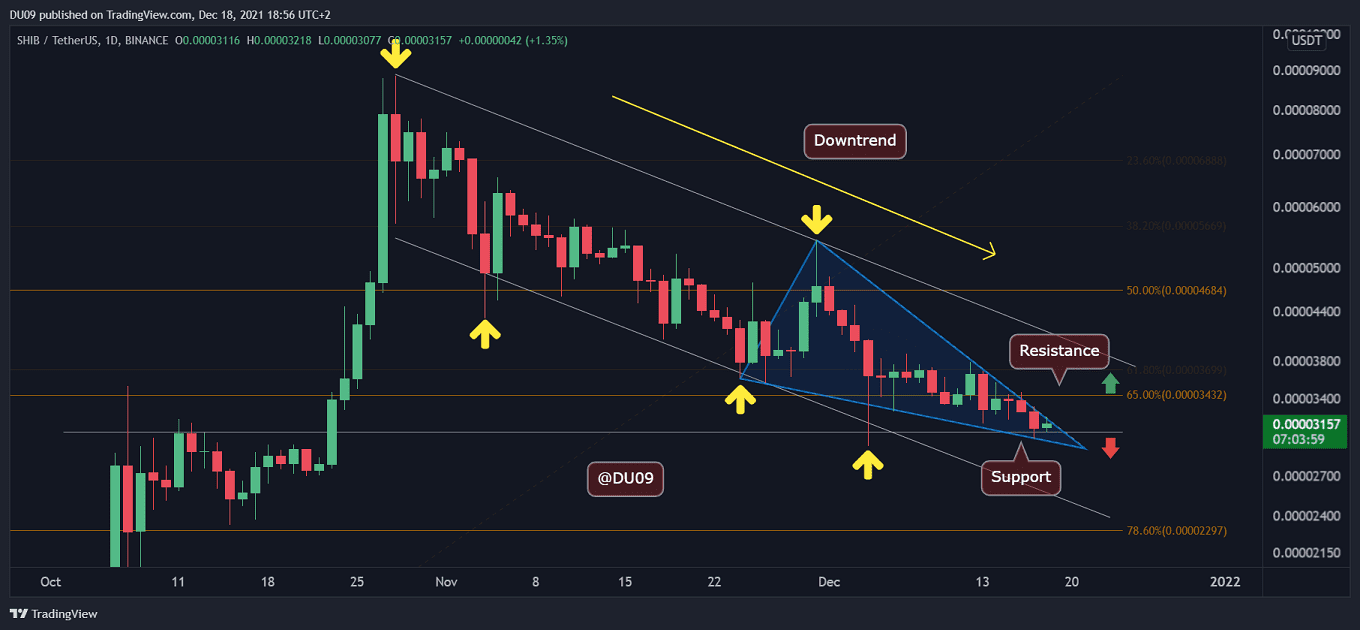
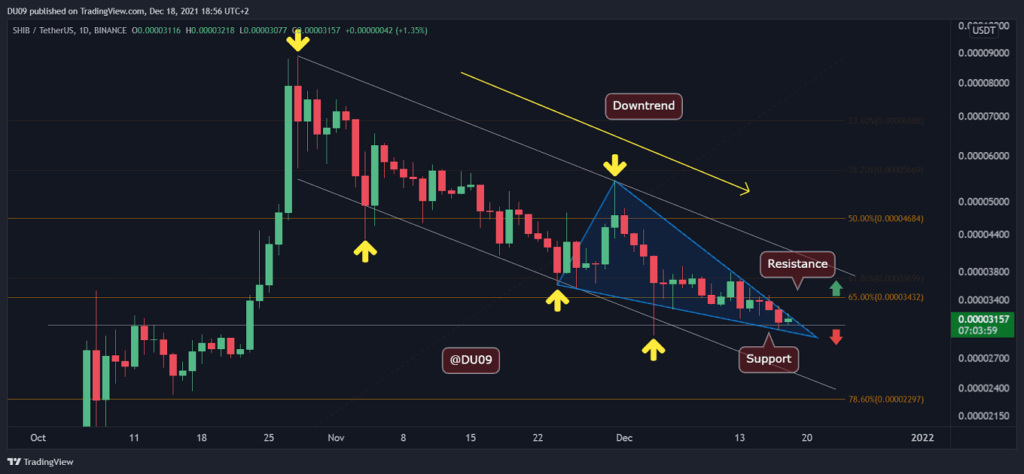
SHIB has finally arrived at the support level of $ 0.000030 which has the best chance of reversing the current downtrend. Indeed, this level was the previous all-time high for October and should provide solid support.
Moreover, the downtrend is forming an ending diagonal wave with converging lines based on Elliot Wave theory (see in blue). A break from this triangle can take the price to the resistance at $0.000034 and may start a significant rally.
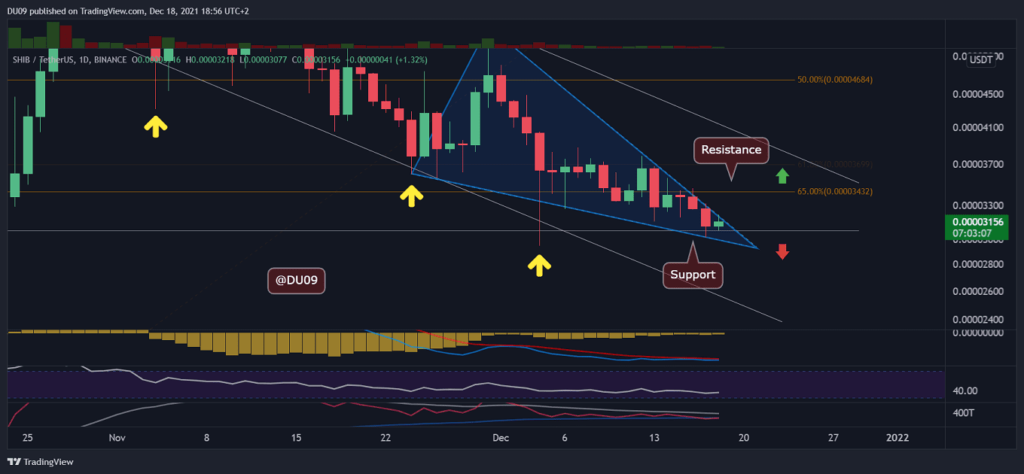
Technical indicators
Trade volume: The volume remained low during this correction. However, a reversal is likely to bring buyers back quickly when looking at the past price action.
RSI: The RSI is making higher lows on the 12-hours timeframe. However, on the daily, this is not yet the case. This suggests SHIB may consolidate above the key support before attempting a rally.
MACD: The daily MACD has not yet made a bullish cross. But it can happen at any time if volatility returns to SHIB because MACD moving averages are very close to each other.
Bias
The bias on SHIB is neutral. A break above the key resistance can turn the bias bullish, while a break below will be bearish.
Short-term prediction for the SHIB price
SHIB’s correction has continued for almost two full months and price has fallen over 60% from an all-time high of $ 0.000088. For this reason, it is likely that the downtrend will reverse soon and a rally of relief is expected.


