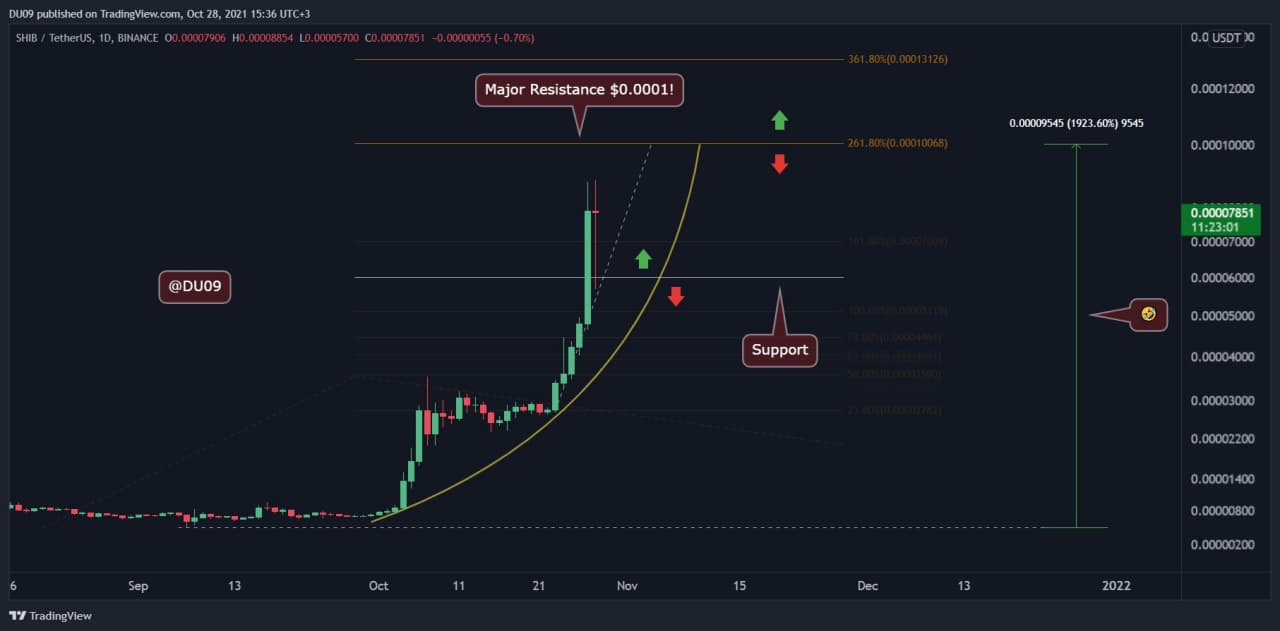
Key support level: $ 0.000060
Key Resistance level: $0.0001
Since our last Shiba Inu (SHIB) analysis, Shiba doubled in price yet again. The current all-time high now stands at $ 0.00008854.
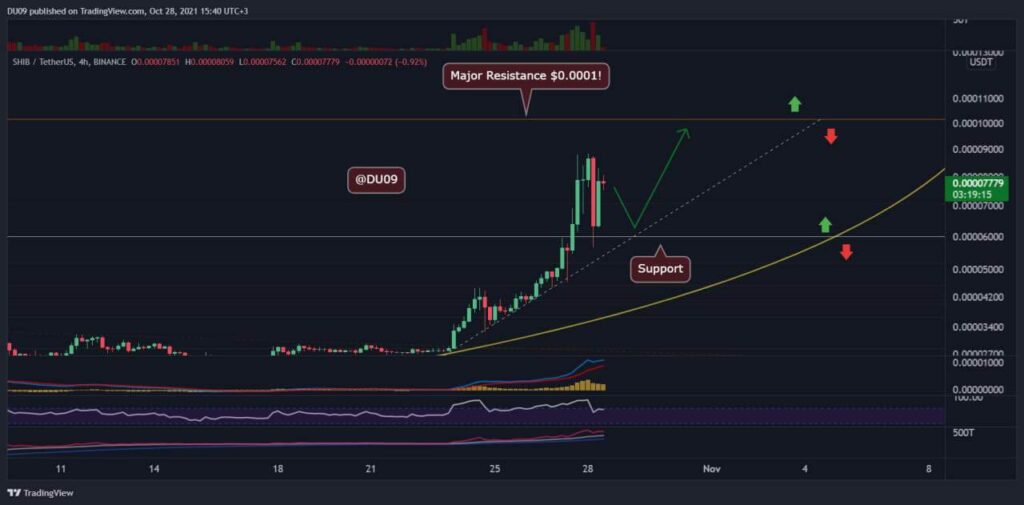
Shiba’s break from the blue pennant (presented in our last analysis) unleashed a considerable rally that has set a new all-time high, and despite a short pullback to support, SHIB appears ready for more! The most obvious resistance right now is at $0.0001.
Shiba can lose another 0 on his way to reaching 1 cent, which is the goal of most fans. On the other end, the support is currently found at $0.000060, which was tested successfully today.
SHIB price technical indicators
Trade volume: The volume continues to be high and manages to keep the price at very high levels. The hype around Shiba is still strong, and the volume reflects this. However, the resistance at $ 0.0001 will be difficult to break.
RSI: The textbook says in a strong bullish trend, a good sign of an impending reversal is when RSI exceeds 90 points. The daily RSI for Shiba is over 90 points, so it is important to be careful. This last daily candle looks like a spinning top as well, which could be a reversal signal.
MACD: MACD is extremely bullish on the daily calendar. However, over shorter time frames, where weaknesses tend to show up earlier, Shiba shows lower highs on the 4-hour MACD histogram. It may also consolidate around these levels forming a pennant before a potential attempt at $0.0001.
Bias
Extreme euphoria. Usually this indicates that a summit can be done soon. However, Shiba could also continue up before a reversal.
Short-term prediction for the SHIB price
The key level that everyone has their eyes on is $ 0.0001. Can Shiba break this resistance? If so, then he could get into another massive rally before any reversal. However, many bulls could have this as a target for profit taking due to $0.0001 being a key psychological level in the Shiba community. This can lead to a sharp rejection of resistance and a significant drop to support.


