
Ethereum continued its wave of gains in October, extending its gains to nearly 60% since the start of the month. However, a correctional phase was in effect as Bitcoin’s snapped a 12-day low at $58,000. For ETH, the charge has now fallen to short-term support levels of $ 4,000 and $ 3,650. Should bulls falter at these levels, ETH could further weaken to $3,500-$3,100 before mustering strength for a new ATH.
Ethereum Daily Chart
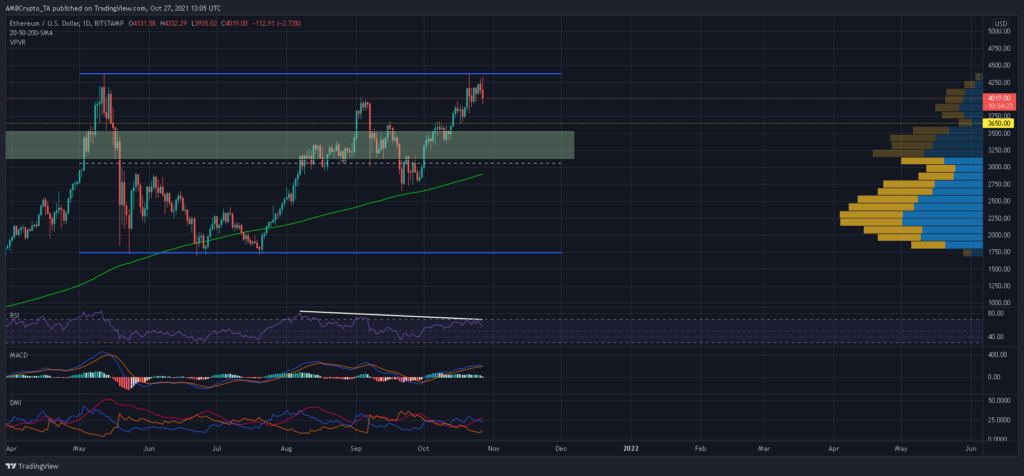
Ethereum’s closest defensive option was available at $ 4,000 and $ 3,700, but the visible range profile suggested that these regions had yet to be established as a reliable support area. Should bears capitalize on these cracks, the lack of demand above $3,500 would see ETH decline by a further 10% before moving to a stronger support area.
During this time, many defensive resources were available below $ 3,650. A support line of $3,350 has already aided ETH during a mini-correction in mid-October.
To forgo a bullish thesis, bears should aim for a close below the midline of its horizontal channel and the 200-SMA (green). From there, a potential decline all the way up to $2,700 would become a serious threat.
Reasoning
According to ETH’s daily RSI, its current correction was long overdue. Lower spikes along the RSI have identified a slight bearish divergence in ETH price action – signaling a possible decline. In fact, ETH was in line for further losses as the MACD and Directional Movement Index also approached bearish crossovers. However, expect these indicators to maintain above each of their respective half-lines as ETH was very much within a bullish bias.
Conclusion
In case ETH gives ground on $ 4,000 and $ 3,700, expect the bulls to keep price in a strong support zone of $ 3,500 to $ 3,100. The introduction of new longs would see ETH mount another attack at $4,400 and target a new ATH.


