In this article, BeInCrypto looks at on-chain bitcoin indicators like the number of transactions and address count. This is done in order to compare the models with previous market cycles.
The number of BTC transactions is increasing but is still disproportionate compared to the price increase. In contrast, the number of addresses with a non-zero balance is approaching a new all-time high.
Number of BTC transactions
The number of BTC transactions has not always increased alongside the BTC price. While transactions hit an all-time high of 406,953 in December 2017, the price of BTC hit its current all-time high in April 2021.
Interestingly, the number of transactions has created three lower highs (black arrows) since the aforementioned 2017 all-time high. This means that the price increase is not fully supported by a proportional increase in the number of transactions, although the two clearly have a positive relationship.
Since the April 2021 all-time high, both the BTC price and the number of transactions have been decreasing. The latter hit an annual low of 195,248 on July 2 before finally rebounding.
Therefore, even though the number of transactions is now moving upwards, the reading can still be seen as bearish when compared to the price movement.
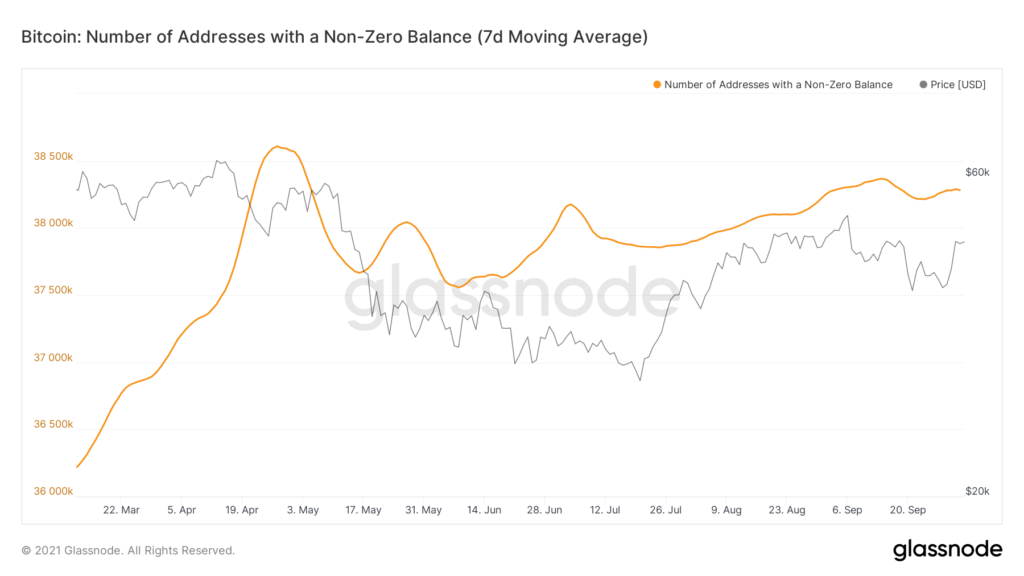
Total number of addresses
The number of non-zero BTC addresses offers a different perspective when compared to the number of transactions. This figure has continued to increase since the 2017 top and reached new all-time highs roughly at the same time that the BTC price did.
However, its movement differs considerably from that of the 2014-2017 market cycle.
In the 2014-2017 cycle, there were two dips in the indicator (black circles) prior to the crash in December 2017 (black arrow).
In the current cycle, there were also two declines in late 2020 / early 2021. However, after the April all-time high price was reached, what followed was not a sharp fall, but rather a very gradual decrease, more akin to consolidation.
Therefore, the decline after the current record price has nothing to do with the decline after the 2017 high, which was followed by a two-year correction period.

The movement is seen more clearly when zooming in and shows that the number of addresses with a non-zero balance is moving toward a new all-time high.
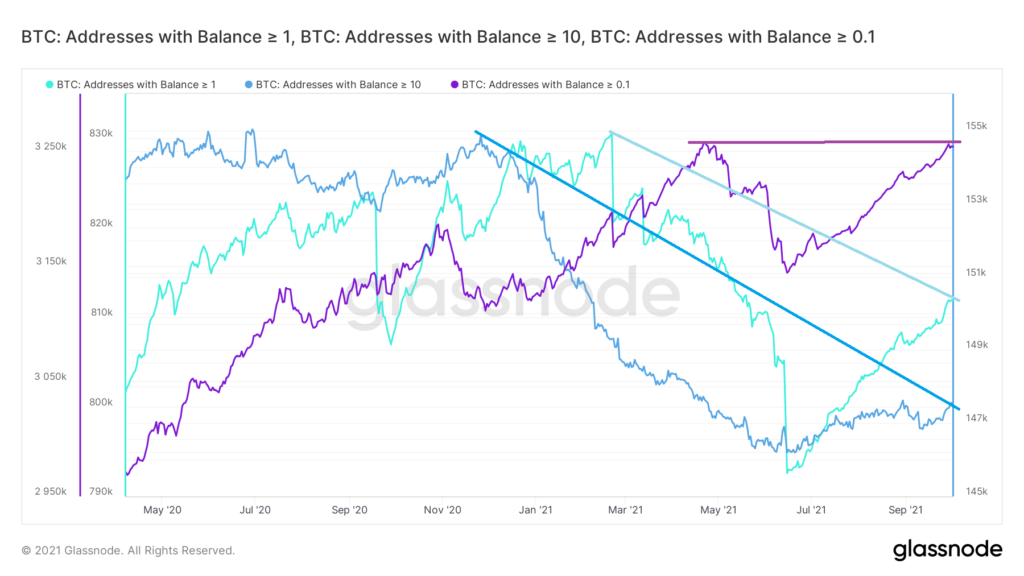
Bitcoin addresses by quantity
Finally, the addresses are divided by the amount of BTC held. They are classified as follows:
- Addresses with more than 1 BTC = green
- 10 = blue
- >0.1 = purple
The number of addresses with a balance greater than> 0.1 is close to reaching a new all-time high. However, those with >1 and >10 are lagging behind.
Therefore, the continuous increase in the number of BTC addresses is mainly fueled by small accounts. This is not a bullish development, since small account domination is normally seen as a sign of a market top.
However, the progress of medium and large accounts, while being disproportionate, can still be a sign of accumulation before the continuation of the bullish race.